
How do I create a running bar chart using Google Colab?
Even though there are many ways to create a similar visualization. I would like to present to you how I did it using a google collab.
If you are not familiar with Google Colab. If you have ever used a word document on the cloud or google docs, Google Colab is a word document for coding using Jupyter Notebook Software.
Now let’s begin to recreate the exact visualization with the code I used.
Steps to Recreate this Graph in an easy way
Step 1: Get the Data and understand it
The data used in this visualization is from Kaggle. Following is the original dataset link from Kaggle
Link: https://www.kaggle.com/code/miteshmauriya/salary-per-person-in-indonasia
If you explore the data dictionary, it contains the following
- Year
- Region Name
- Salary Value
- Grand Total
Step2: Cleaned Data for you to use
I have done some magic and created ready-to-use data for your visualization. Here is the file for you to download
Download the file and unzip the CSV file.
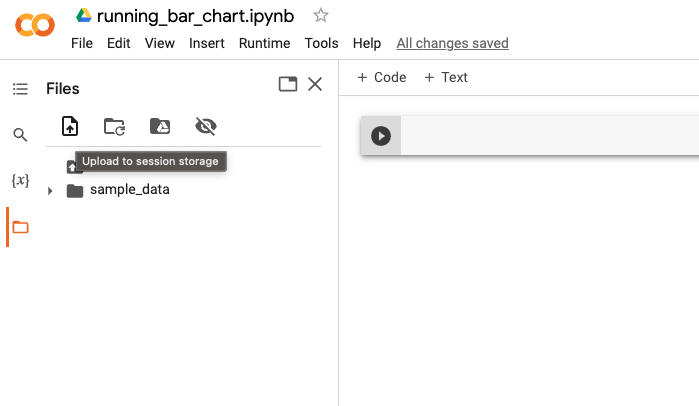
Step 3: Open Google Colab and run the following code step by step
#installation of the required library
!pip install bar_chart_race
#importing the required libraries
import pandas as pd
import bar_chart_race as bcr
Upload the CSV file to Google Colab Storage from the downloaded place
# Read the file into pandas dataframe

df= pd.read_csv('Indonesia_salary_region.csv')
df= df.set_index('Year')

#Check the file
df.head()
Here comes the magic code for you!!!
bcr.bar_chart_race(df=df, filename=None, orientation ='h',
            sort='desc',
            n_bars=10,fixed_order=False,
            fixed_max=True,
            steps_per_period = 1,
            interpolate_period=False,period_label={'x': 0.99,'y':.25,'ha':'right','va':'center'},

            period_summary_func = lambda v,r :{ 'x':.99, 'y':.18, 's': f'Mean Salary: {v.nlargest(10).sum():,.0f}',
                                                'ha':'right', 'size':8, 'family':'Courier New'},
            perpendicular_bar_func='mean',
            label_bars=True,
            bar_size = 0.95,
            period_length=800,
            figsize=(8,3),
            dpi=144,
            cmap='dark12',
            title ='Indonesia Salary by Region from Year 1997 to 2022')
Note: Sometimes, when you copy the code indentation can be missed. Adjust the spacing to make it work
Here is what the output looks like

Further experimentation
Now, you might have similar questions like me
- How can we do similarly to any other dataset?
- Can I download the video?
- Is it possible to customize the bar chart colors?
- Is it possible to reduce the speed of the running bar chart ?
Here is the resource link that will help you answer the questions
Link: https://pypi.org/project/bar-chart-race/
Wish you a happy learning. Feel free to connect with me on LinkedIn and ask questions.

Leave a comment