
1. Introduction

Version control repositories like CVS, Subversion or Git can be a real gold mine for software developers. They contain every change to the source code including the date (the “when”), the responsible developer (the “who”), as well as a little message that describes the intention (the “what”) of a change.
In this notebook, we will analyze the evolution of a very famous open-source project – the Linux kernel. The Linux kernel is the heart of some Linux distributions like Debian, Ubuntu or CentOS. Our dataset at hand contains the history of kernel development of almost 13 years (early 2005 – late 2017). We get some insights into the work of the development efforts by
- identifying the TOP 10 contributors and
- visualizing the commits over the years.
In [144]:
# Printing the content of git_log_excerpt.csv
f = open('datasets/git_log_excerpt.csv','r')
print(f.read())
1502382966#Linus Torvalds
1501368308#Max Gurtovoy
1501625560#James Smart
1501625559#James Smart
1500568442#Martin Wilck
1502273719#Xin Long
1502278684#Nikolay Borisov
1502238384#Girish Moodalbail
1502228709#Florian Fainelli
1502223836#Jon Paul Maloy
2. Reading in the dataset
The dataset was created by using the command git log --encoding=latin-1 --pretty="%at#%aN" in late 2017. The latin-1 encoded text output was saved in a header-less CSV file. In this file, each row is a commit entry with the following information:
timestamp: the time of the commit as a UNIX timestamp in seconds since 1970-01-01 00:00:00 (Git log placeholder “%at“)author: the name of the author that performed the commit (Git log placeholder “%aN“)
The columns are separated by the number sign #. The complete dataset is in the datasets/ directory. It is a gz-compressed csv file named git_log.gz.
In [146]:
# Loading in the pandas module as 'pd'
import pandas as pd

# Reading in the log file
git_log = pd.read_csv("datasets/git_log.gz",sep='#',names= ['timestamp',
                  'author'], header=None, encoding='latin-1')


# Printing out the first 5 rows
print(git_log.head())
    timestamp          author
0  1502826583  Linus Torvalds
1  1501749089   Adrian Hunter
2  1501749088   Adrian Hunter
3  1501882480       Kees Cook
4  1497271395       Rob Clark
3. Getting an overview
The dataset contains the information about every single code contribution (a “commit”) to the Linux kernel over the last 13 years. We’ll first take a look at the number of authors and their commits to the repository.
In [148]:
# calculating number of commits
number_of_commits = git_log.shape[0]

# calculating number of authors
number_of_authors =  git_log.author.nunique()                   # printing out the results
print("%s authors committed %s code changes." % (number_of_authors, number_of_commits))
17385 authors committed 699071 code changes.
4. Finding the TOP 10 contributors
There are some very important people that changed the Linux kernel very often. To see if there are any bottlenecks, we take a look at the TOP 10 authors with the most commits.
In [150]:
# Identifying the top 10 authors
top_10_authors = git_log.groupby('author').count().reset_index().sort_values(by='timestamp', ascending=False)[:10]
top_10_authors = top_10_authors.set_index('author')
# Listing contents of 'top_10_authors'
display(top_10_authors)
| author | timestamp |
|---|---|
| Linus Torvalds | 23361 |
| David S. Miller | 9106 |
| Mark Brown | 6802 |
| Takashi Iwai | 6209 |
| Al Viro | 6006 |
| H Hartley Sweeten | 5938 |
| Ingo Molnar | 5344 |
| Mauro Carvalho Chehab | 5204 |
| Arnd Bergmann | 4890 |
| Greg Kroah-Hartman | 4580 |
5. Wrangling the data
For our analysis, we want to visualize the contributions over time. For this, we use the information in the timestamp column to create a time series-based column.
In [152]:
# converting the timestamp column
git_log['timestamp'] = pd.to_datetime(git_log['timestamp'], unit='s')

# summarizing the converted timestamp column
git_log.describe()
Out[152]:
| timestamp | author | |
|---|---|---|
| count | 699071 | 699070 |
| unique | 668448 | 17385 |
| top | 2008-09-04 05:30:19 | Linus Torvalds |
| freq | 99 | 23361 |
| first | 1970-01-01 00:00:01 | NaN |
| last | 2037-04-25 08:08:26 | NaN |
6. Treating wrong timestamps
As we can see from the results above, some contributors had their operating system’s time incorrectly set when they committed to the repository. We’ll clean up the timestamp column by dropping the rows with the incorrect timestamps.
In [154]:
# determining the first real commit timestamp
first_commit_timestamp = git_log[git_log['author']=='Linus Torvalds'].timestamp.min()

# determining the last sensible commit timestamp
last_commit_timestamp = git_log.timestamp.max()


# filtering out wrong timestamps
corrected_log = git_log.where((git_log['timestamp']>=first_commit_timestamp) & (git_log['timestamp']<'01-01-2018'))

# summarizing the corrected timestamp column
corrected_log['timestamp'].describe()
Out[154]:
count                  698569
unique                 667977
top       2008-09-04 05:30:19
freq                       99
first     2005-04-16 22:20:36
last      2017-10-03 12:57:00
Name: timestamp, dtype: object
7. Grouping commits per year
To find out how the development activity has increased over time, we’ll group the commits by year and count them up.
In [156]:
# Counting the no. commits per year
commits_per_year = corrected_log.groupby(pd.Grouper(key='timestamp', freq='AS')).count()

# Listing the first rows
commits_per_year.head(5)
Out[156]:
| timestamp | author |
|---|---|
| 2005-01-01 | 16229 |
| 2006-01-01 | 29255 |
| 2007-01-01 | 33759 |
| 2008-01-01 | 48847 |
| 2009-01-01 | 52572 |
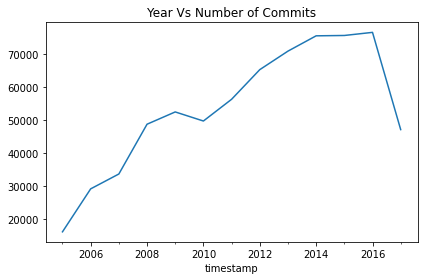
8. Visualizing the history of Linux
Finally, we’ll make a plot out of these counts to better see how the development effort on Linux has increased over the the last few years.
In [158]:
# Setting up plotting in Jupyter notebooks
import matplotlib.pyplot as plt
%matplotlib inline

# plot the data
commits_per_year.reset_index()

commits_per_year.plot(kind='line', y='author',title='Year Vs Number of Commits',legend=False)
plt.show()
DEBUG:matplotlib.pyplot:Loaded backend module://ipykernel.pylab.backend_inline version unknown.
In [159]:
9. Conclusion
Thanks to the solid foundation and caretaking of Linux Torvalds, many other developers are now able to contribute to the Linux kernel as well. There is no decrease of development activity at sight!
In [160]:
# calculating or setting the year with the most commits to Linux
year_with_most_commits = 2016
I

Leave a comment